
Biological Age Calculator: How It Works, What It Measures, and How to Get Yours Free
Your birth certificate measures time. A biological age calculator measures wear. Here's what actually goes into the number, how the three main methods compare on accuracy and cost, and how to get a credible estimate in three minutes.
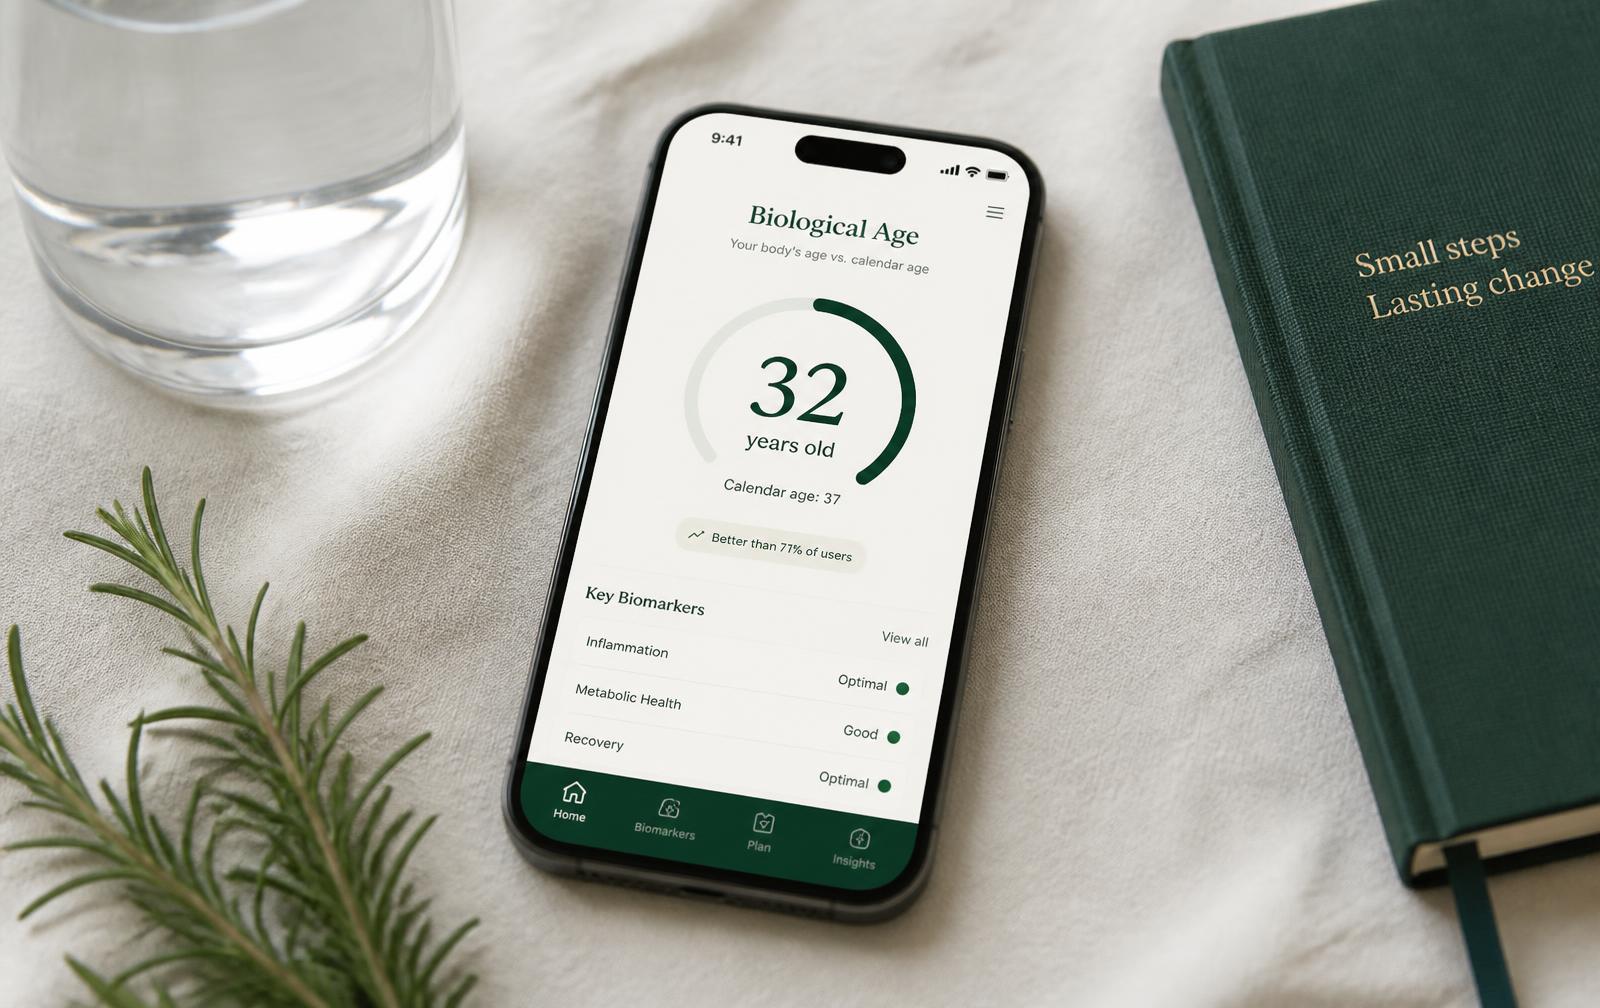
Two people turn 45 on the same day. One has the cardiovascular capacity, inflammation profile, and glucose control of a 37-year-old. The other looks 53 on every measure that predicts death. Same candles, very different risk. A biological age calculator is the tool that tells you which one you are — and, more usefully, which inputs are dragging your number in the wrong direction.
The 60-second answer
- • A biological age calculator converts measurable health inputs into an age in years that reflects function, not birthdays.
- • Three tiers exist: lifestyle-based (free, instant, best for tracking), blood-based like PhenoAge (~$50–100, strong mortality prediction), and epigenetic clocks (~$200–500, research gold standard).
- • The heaviest-weighted inputs are cardiorespiratory fitness, sleep, visceral fat, and resting heart rate.
- • Biological age is modifiable — trials report 1–3 year reductions in 8 weeks to 12 months.
- • Start free: the Aevon Health Assessment returns an estimate in about three minutes.
What a biological age calculator actually measures
Chronological age is a single number that increases at a fixed rate for everyone. Biological age is a statistical construct: researchers take a large cohort, record measurable variables, follow participants for years, and then fit a model that answers one question — which combination of these numbers best predicts who dies or gets sick first? The output is re-expressed in years so it's interpretable.
That framing matters, because it tells you what the number is and isn't. It is a calibrated risk score wearing the costume of an age. It is not a diagnosis, a lifespan prediction, or a measurement of any single organ. Its real value is comparative: you versus the population, and you now versus you three months ago.
The three methods, compared
| Method | Inputs | Cost / speed | Best for |
|---|---|---|---|
| Lifestyle / questionnaire | Sleep, fitness, waist, resting HR, habits, stress, purpose | Free · 3 minutes | Baseline, finding your weakest domain, frequent retesting |
| Blood-based (PhenoAge) | 9 standard labs incl. CRP, glucose, albumin, RDW, lymphocyte % | $50–100 · days | Objective precision; outperforms chronological age for mortality |
| Epigenetic clock | DNA methylation at hundreds to thousands of CpG sites | $200–500 · 3–6 weeks | Research-grade tracking, annual cadence |
A common mistake is starting at the expensive end. An epigenetic result of "you are 3.4 years older than your calendar age" is interesting but not actionable on its own — it doesn't tell you whether the cause is your six-hour sleep average or your visceral fat. Lifestyle-based calculators are less precise but far more prescriptive, which is why they belong first in the sequence. Our full comparison of the three testing methods goes deeper on accuracy trade-offs.
The inputs that carry the most weight
Not all variables are equal. Ranked roughly by effect size in longitudinal cohort data:
- Cardiorespiratory fitness (VO2 max). The single strongest modifiable predictor of all-cause mortality. Moving from the bottom quartile to above average is associated with a larger risk reduction than quitting smoking. See how to increase VO2 max.
- Sleep duration and quality. Chronic short sleep accelerates measured aging across immune, metabolic, and cardiovascular markers. Both duration and architecture matter — see how to increase deep sleep.
- Waist circumference / visceral fat. A better aging signal than BMI, because visceral adipose tissue is metabolically active and drives inflammation.
- Resting heart rate and HRV. Cheap, sensitive proxies for autonomic balance and recovery capacity — how to improve HRV.
- Smoking and alcohol. Large, dose-dependent, and among the fastest to improve after cessation.
- Diet quality. Pattern beats individual nutrients — the best diet for longevity.
- Muscle mass and strength. Grip strength alone predicts mortality independent of body size.
- Purpose, stress, and social connection. The most under-measured tier — consistently associated with mortality in cohorts even after adjusting for behavior.
How the Aevon assessment builds your estimate
The free Aevon Health Assessment covers ten longevity domains rather than the three or four typical of consumer quizzes. Each domain is scored, weighted according to its evidence strength, and calibrated against your age and sex — a resting heart rate of 68 means something different at 28 than at 68. The composite becomes a Wellness Score, and the score is converted into a years-offset from your calendar age.
Where the technology differs from a static quiz is what happens next. Instead of ending at a number, the result maps to a Health Blueprint: your two weakest domains, the specific interventions with the best evidence for those domains, and the expected timescale. Pro members can upload lab results, which re-weights the estimate from lifestyle-driven toward biomarker-driven, and the AI toolkit turns the gap into concrete training, nutrition, sleep, and supplement protocols.
Calculate your biological age free
Three minutes, ten longevity domains, no card required. You'll get a Wellness Score, a biological age estimate, and a preview of the Blueprint built for your weakest domains.
How to actually lower the number
Biological age responds to inputs, and the response is measurable within a training block. A realistic 12-week sequence, in priority order:
- Weeks 1–2: fix sleep opportunity. Fixed wake time, 7.5-hour time in bed, cool dark room. Nothing else moves as many markers at once.
- Weeks 1–12: build aerobic base. Three to four hours weekly of Zone 2 plus one weekly high-intensity session. This is where VO2 max — and the largest single risk reduction — comes from.
- Weeks 2–12: resistance train twice weekly. Compound lifts, progressive load, protecting muscle mass and insulin sensitivity.
- Weeks 3–12: shift the plate. Protein at every meal, fiber above 30 g, olive oil as the default fat, and an eating window that ends three hours before bed.
- Week 12: retest. Rerun the assessment and compare domain scores, not just the headline age.
Trials of intensive multi-domain protocols have reported epigenetic age reductions in the 1–3 year range over 8 weeks to a year. Treat those figures as an upper bound of what's plausible rather than a promise — but the direction is well supported. Our protocol for reversing biological age breaks the sequence down week by week.
Common mistakes
- Retesting too often. Weekly recalculation measures noise, not aging. Eight to twelve weeks is the floor for lifestyle-based estimates.
- Chasing the number instead of the domain. The age is a summary; the domain scores are the instructions.
- Comparing across methods. A questionnaire estimate and an epigenetic clock answer different questions. Track each against itself.
- Treating a good result as permission. A favorable score reflects current inputs, not accumulated immunity.
- Ignoring sleep because training is easier to log. Sleep is usually the highest-leverage weak domain in the assessments we see.
FAQ
Educational content only. Aevon Health is a wellness platform, not a medical provider. Biological age estimates are risk models, not diagnoses. Consult a qualified clinician before making changes to medication, training, or nutrition.
Keep reading
Related from the Aevon Journal

Facial Analysis: What AI Can Actually Read From Your Face
A single photo holds more health information than a clipboard. How AI facial analysis measures skin, symmetry, and aging, what it reveals about your health and appearance — and how to get assessed free.
Read →
Face Age Test: How Old Does Your Face Really Look?
Face age tests are everywhere — and the science underneath them is real. How AI estimates your perceived age, why looking older than your years predicts health outcomes, and how to measure the aging that actually matters.
Read →
AI Longevity: How AI-Powered Longevity Intelligence Actually Works
Wearables, labs and habit apps produce data; almost none of it changes behavior. Here's what AI-powered longevity intelligence really does — aggregate, estimate, rank, prescribe — and what it can't do.
Read →